Design Museum Foundation
Nobody visits the site, but they open emails.
The non-profit Design Museum brings exhibitions to everyday spaces: parks, restaurants, lobbies, and airports. They were having trouble promoting exhibitions because their website structure didn’t align with business needs. They asked us to redesign the entire experience.
User Interviews
Field Research
User Testing
Information Architecture
Wireframes
UI Design
Prototypes
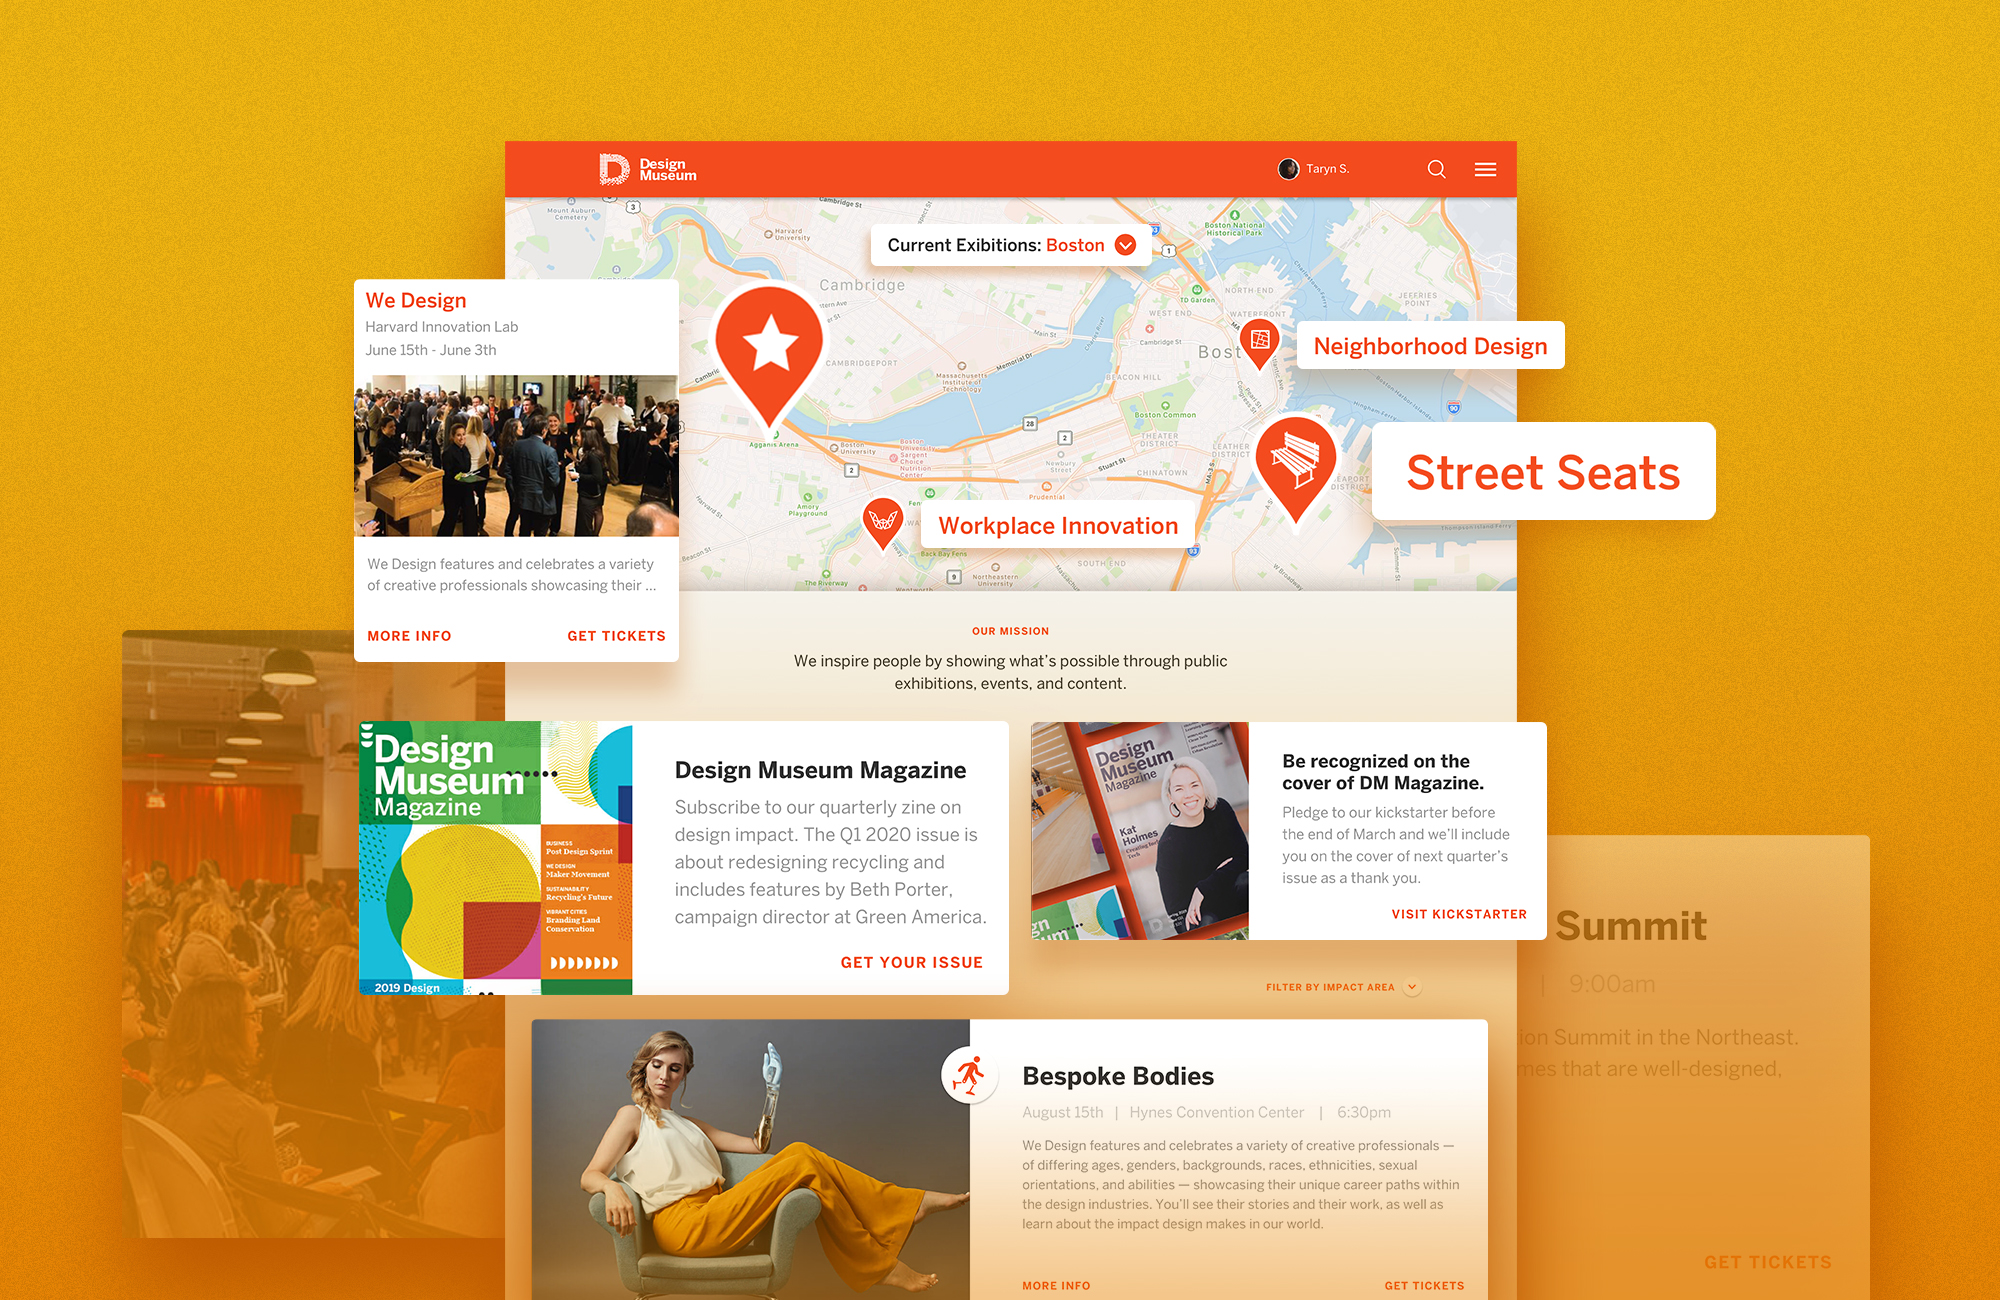
Final Homepage Design
Uncovering opportunities
Interviews with site administrators made it clear that they needed a way to quickly and easily post up-to-date content for concurrent exhibitions across multiple cities. Meanwhile museum attendees needed a way to discover, locate, and sign up for future exhibits.
During these interviews we also learned that the Museum captures a trove of assets (photos, videos, recordings) during each exhibit. We believed there was an opportunity to use that post-exhibit content in our design, and tested this idea during subsequent user research.
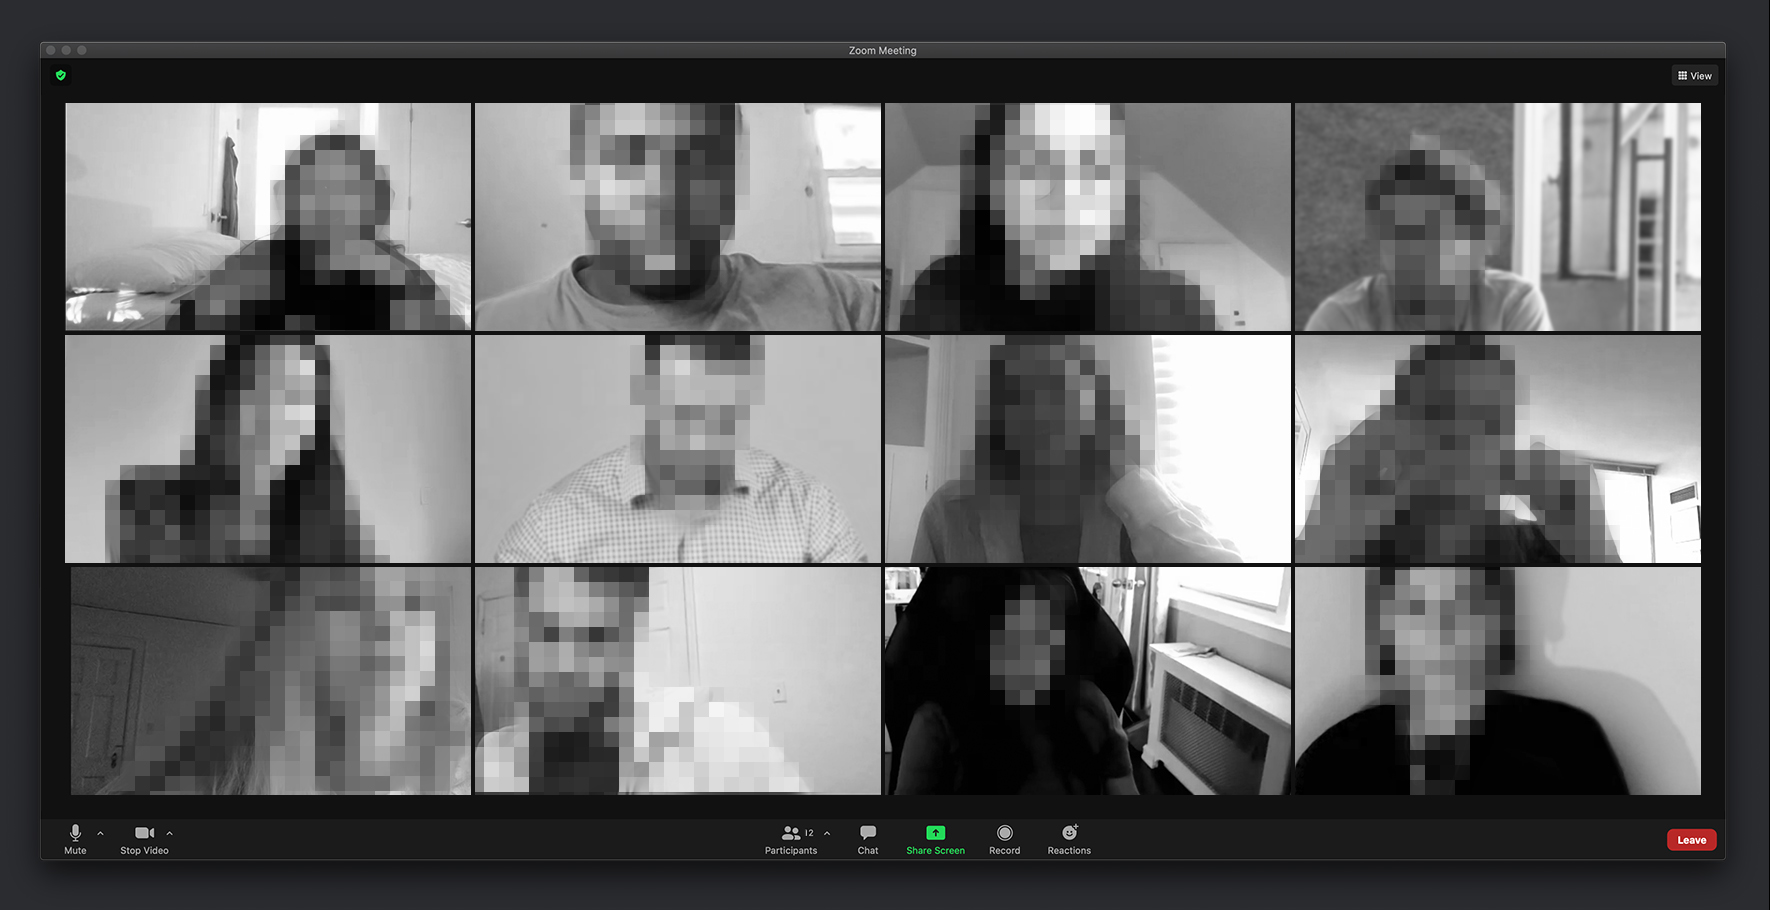
Remotely Interviewing Attendees (obscured to protect identities)
Users believed the emails were up-to-date and the website wasn’t
To recruit participants we attended several exhibitions and scheduled remote interviews to learn if and how they used the Museum website. Almost no one did. Nearly all visitors who weren’t brought by a friend learned about the exhibition from the Museum’s email campaigns because they believed the emails were up-to-date and the website wasn’t. Then every interviewee Google-mapped the exhibition location.
Users expected to browse by location
Using this insight we began testing early paper prototypes of the homepage, giving users map-based options, exhibition-based options, and time-based options to understand what they expected to see when searching for an exhibit. Users preferred the location-based option and assumed all map pins represented current exhibitions.
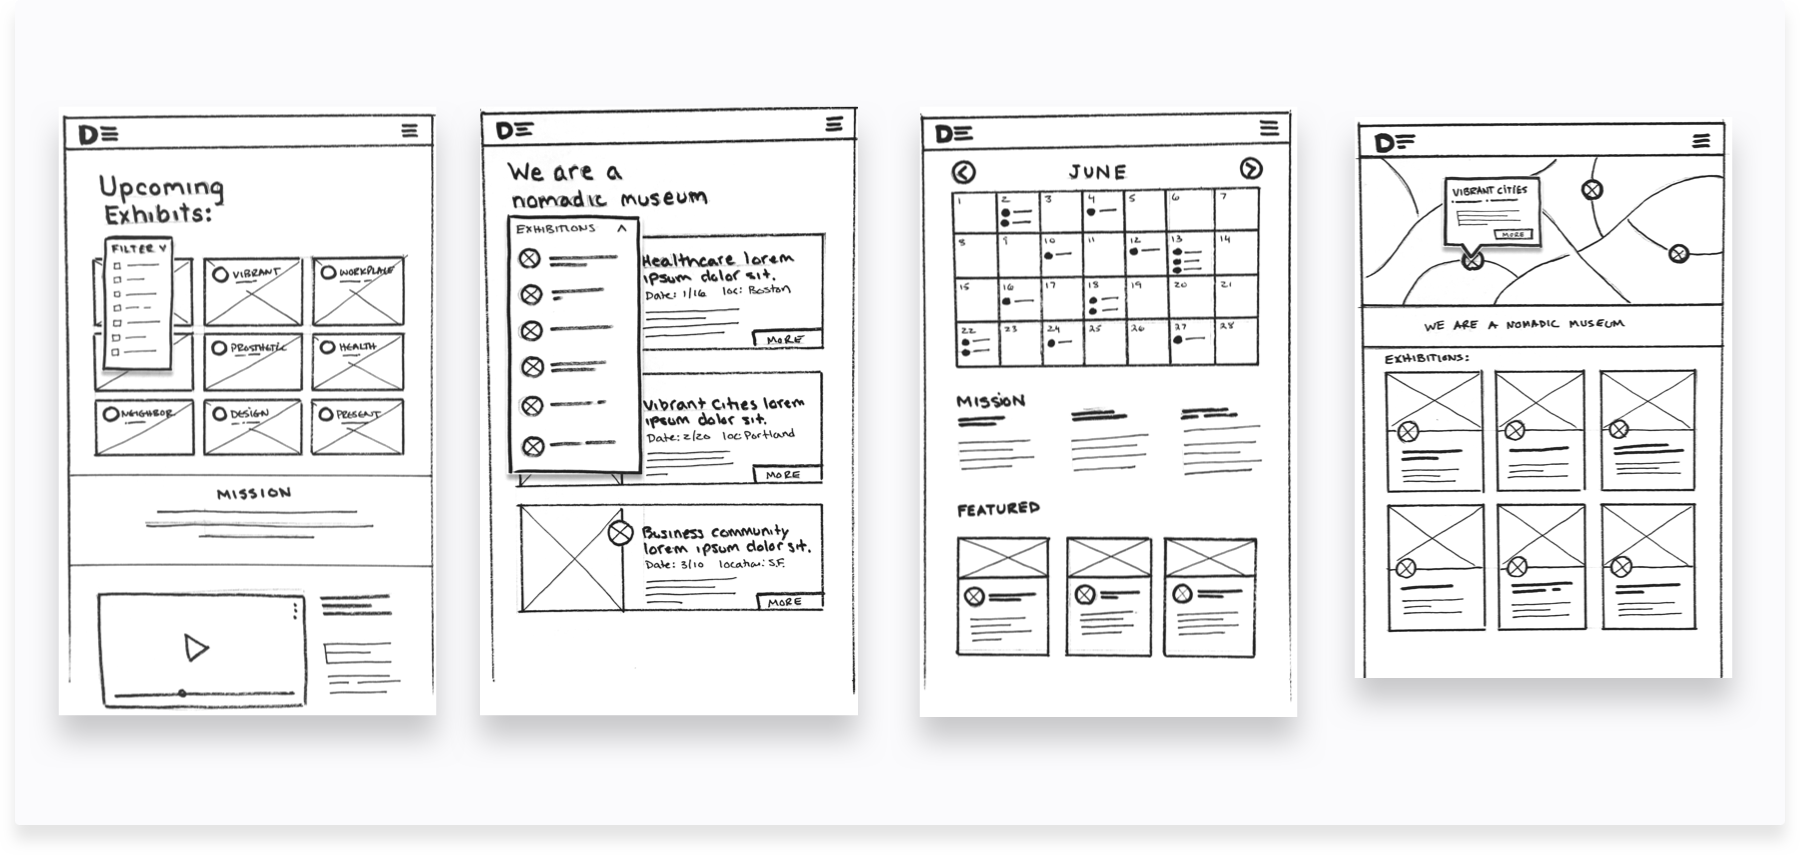
Early Homepage Sketches
Would users consume Design Museum content after an event?
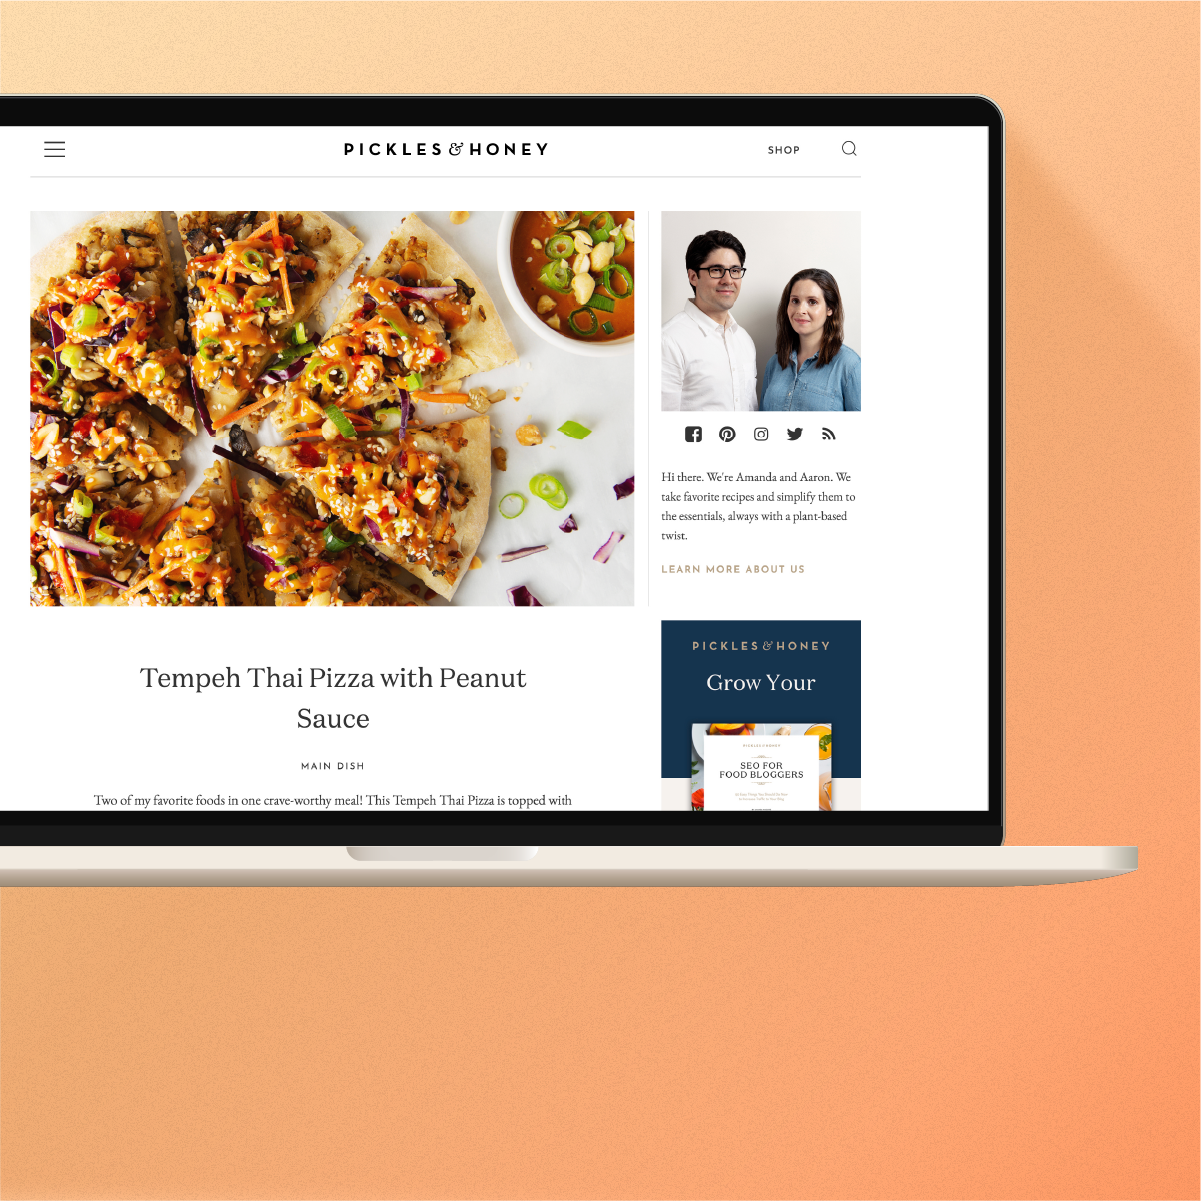
We also surveyed users about design sites they visit to better understand how they consume design-related content. We wanted to learn if users would consume Design Museum exhbition content after they had attended, or if they were unable to attend.
We created a landing page, provided attendees a unique URL, and compared the page traffic to tickets redeemed. To our surprise 57% of attendees visited the new page within 24 hours of the event ending.
Survery results revealed a preference for architecture-oriented sites that offered casual image browsing in curated categories. With our original hunch confirmed we began testing out a new gallery feature in our mid-fidelity wireframes.
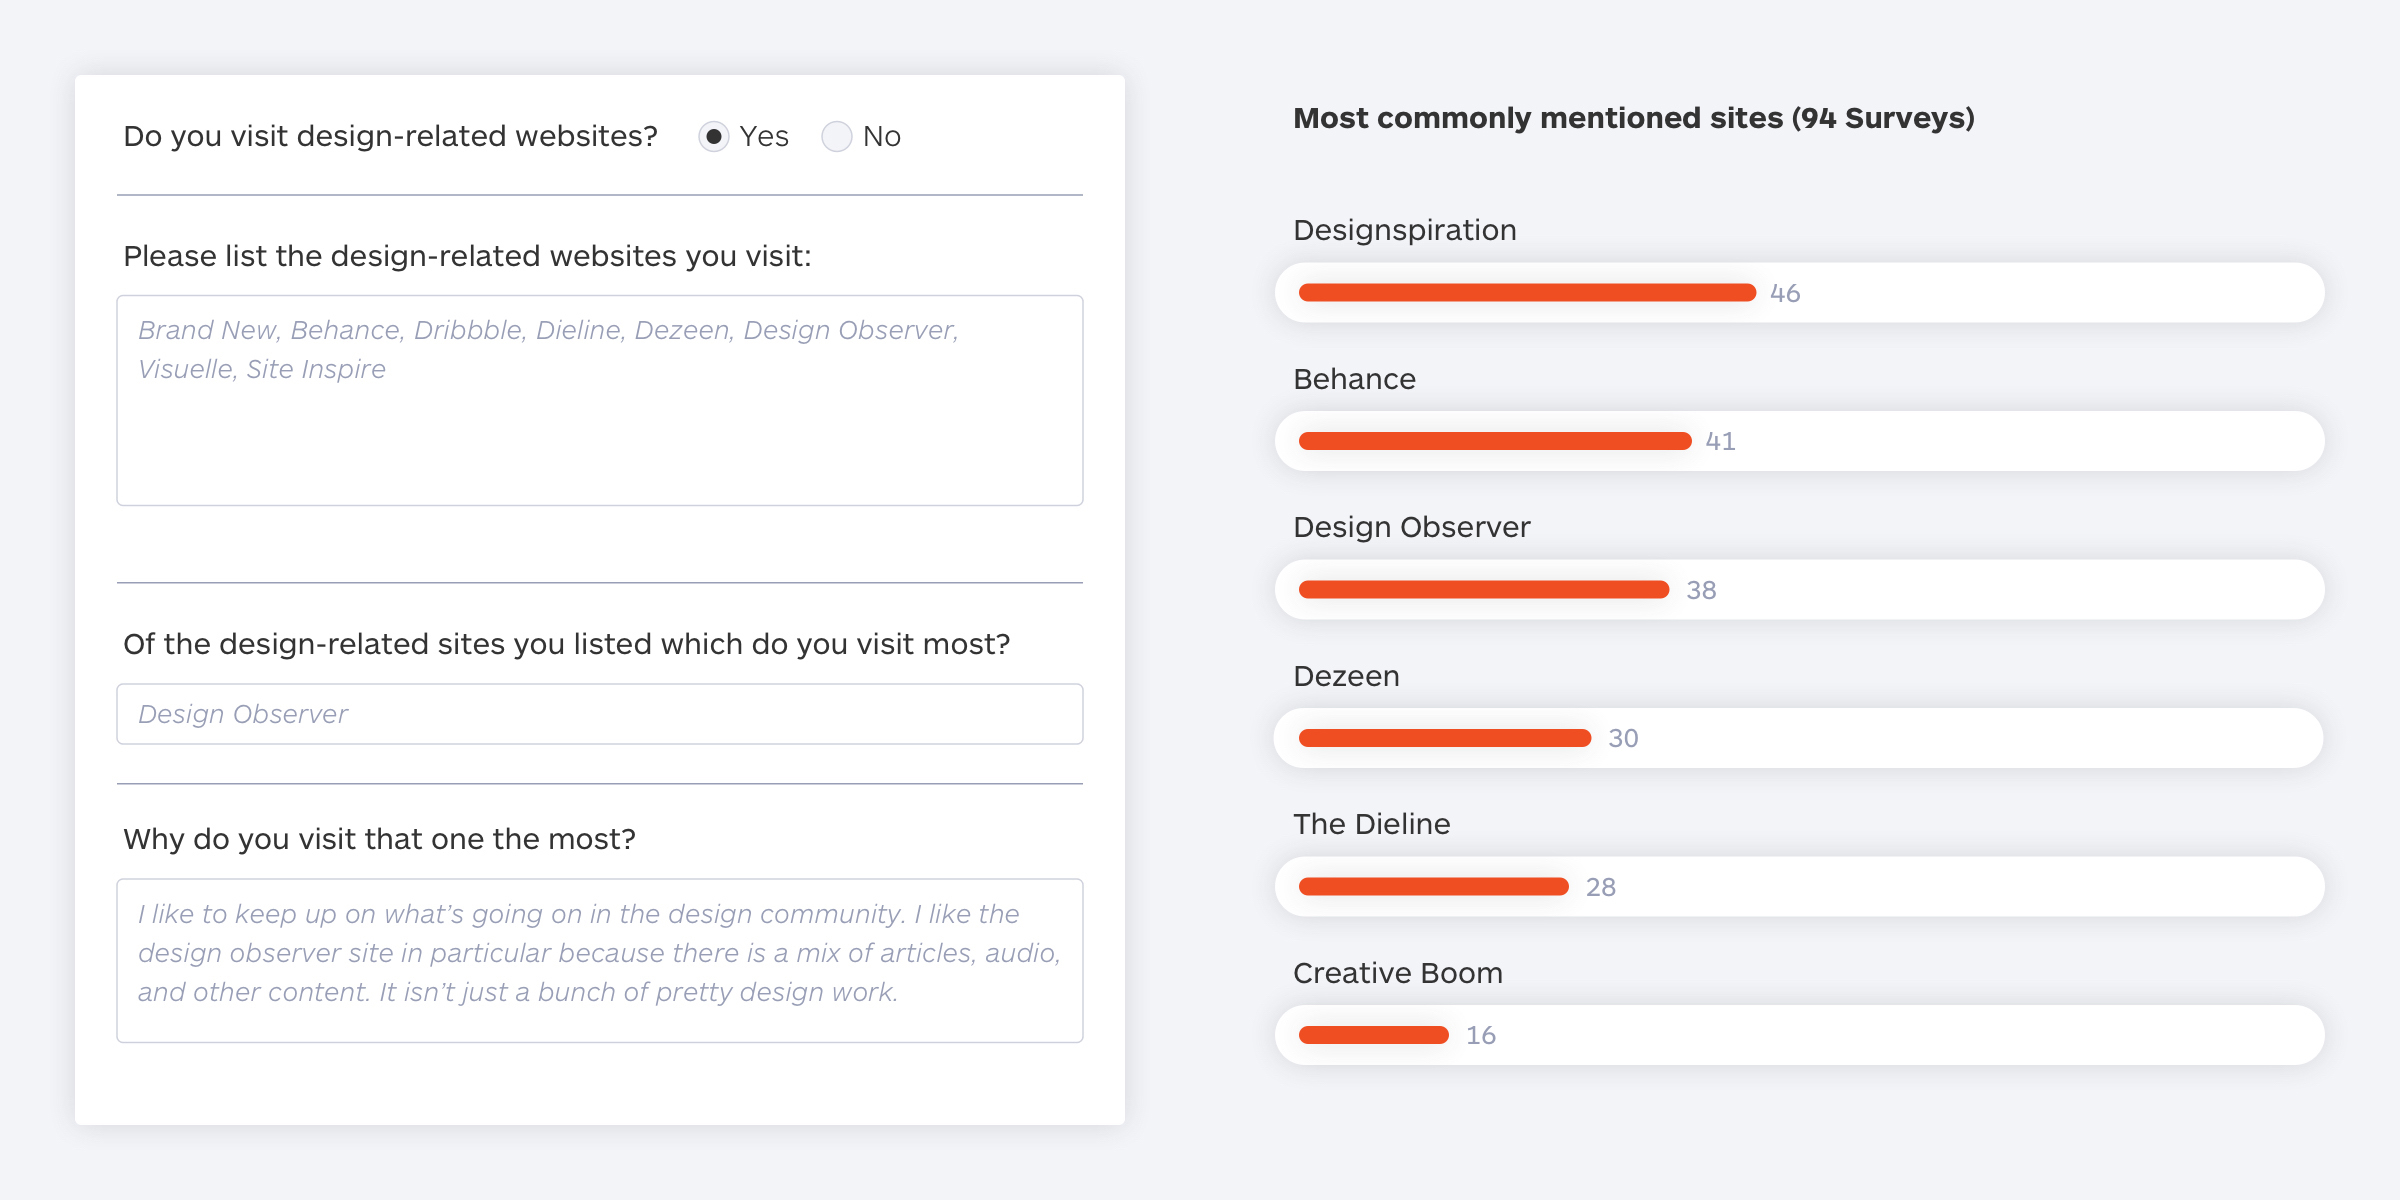
Survey Summary
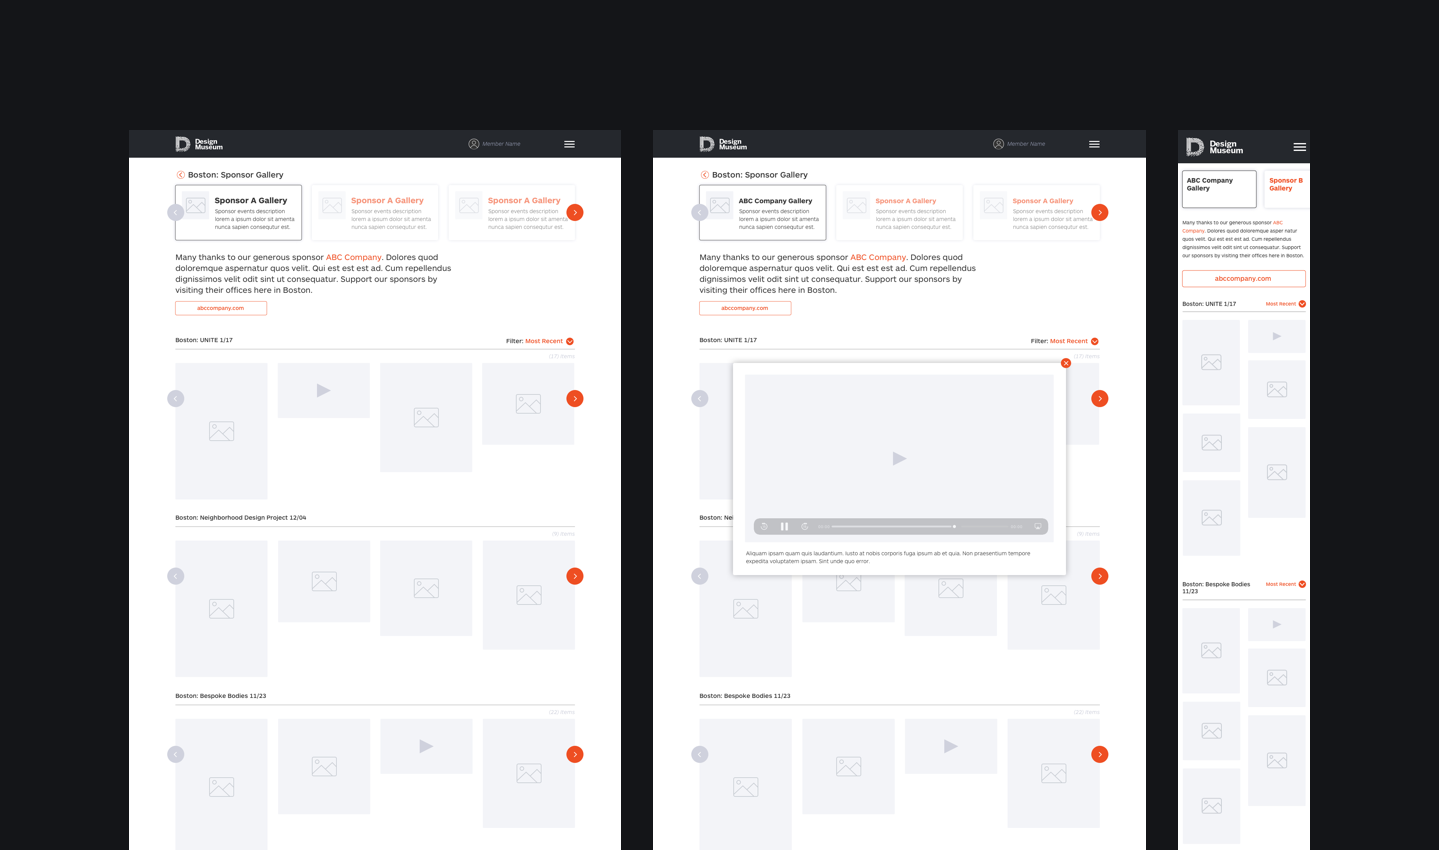
Example Content Gallery Wireframes
A benefit for Design Museum members
It seemed natural to us to place the new galleries navigation item within Programs, however card sorting with 27 museum members taught us that users associated the galleries more with their sponsors than with the events. To create a value-add for museum members static galleries were made public, but content interactions (ie. viewing via lightbox or watching videos) required a museum member sign-in.
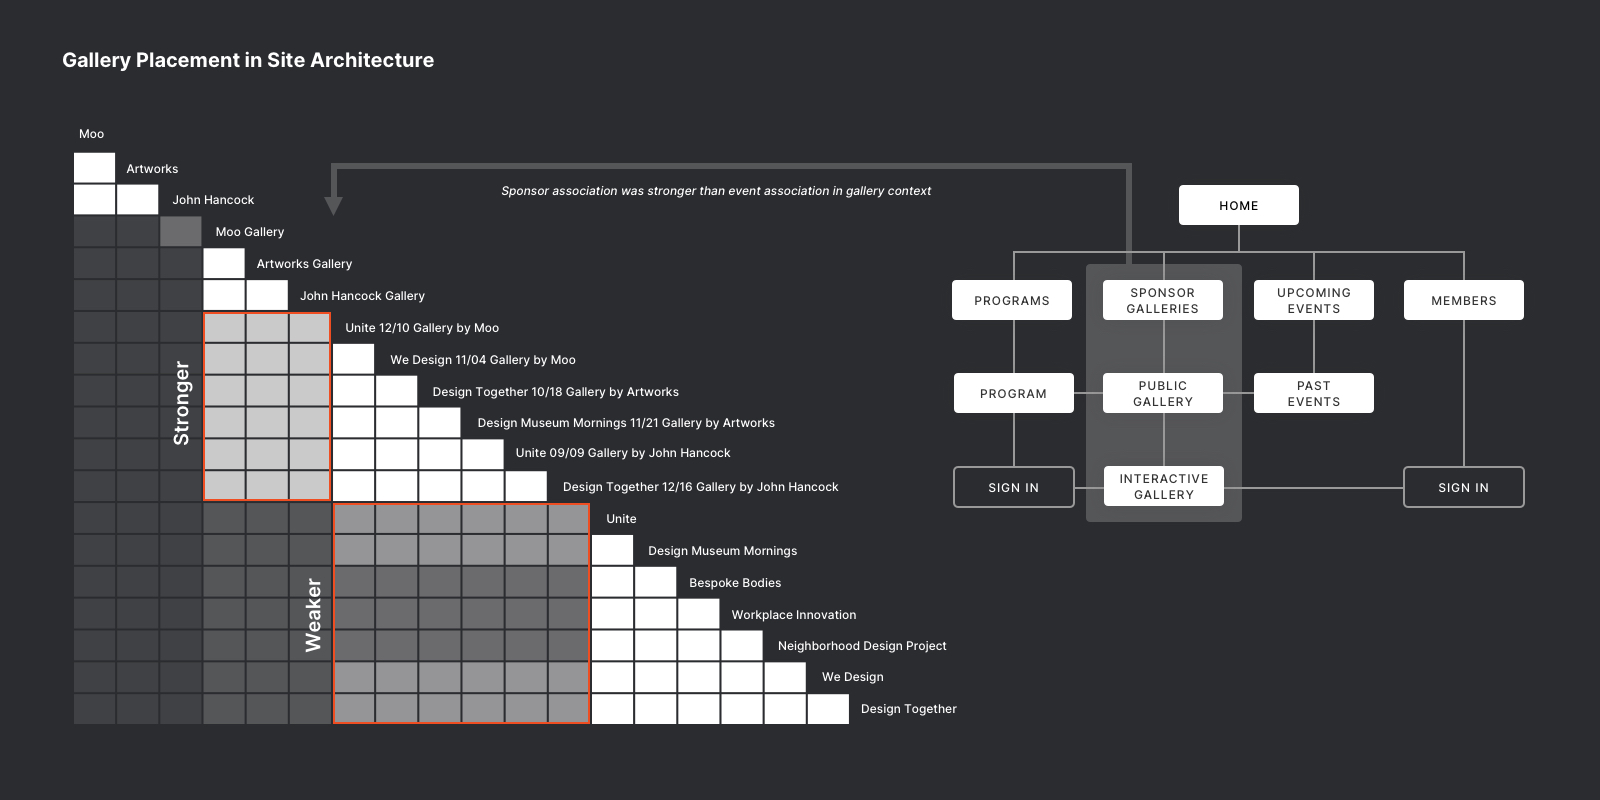
User Flows and Site Architecture
Added value for Design Museum underwriters
We sent site launch announcement emails with teasers for post-event content to a segmented email list of members and attendees. To make the post-exhibit gallery content financially viable, we proposed the Museum create added sponsorship levels for each gallery in the same way they do for underwritten events. This approach proved valuable to the Design Museum in conversation with potential underwriters, and became their way forward.
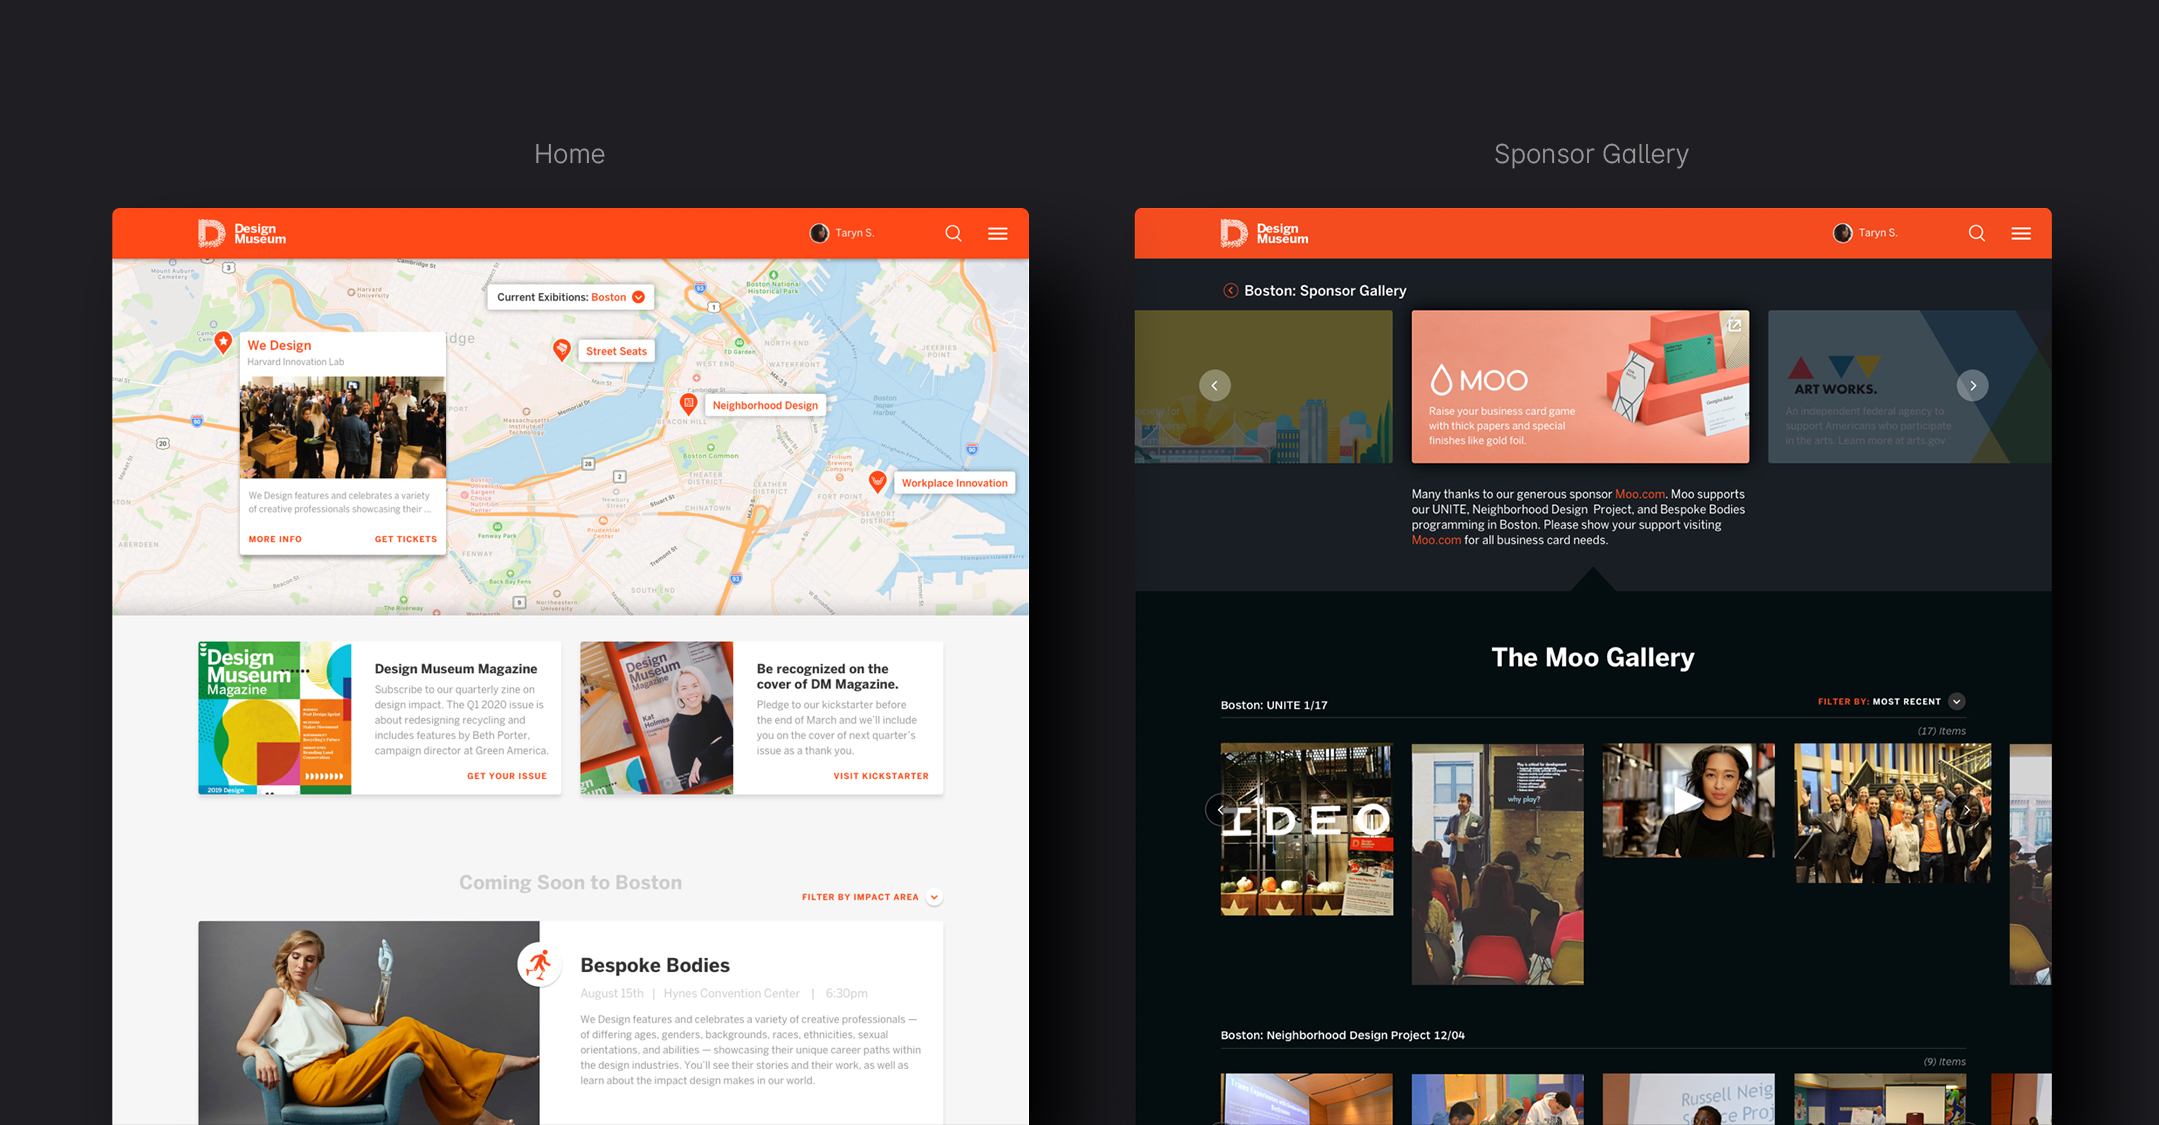
Final Home and Gallery Design
The exhibition hub it was meant to be
After launching the new Design Museum Foundation website the organization saw a 21% average increase in attendees and 18% average increase in overall site traffic over three months.